prometheus-adapter故障排查

现象
安装完 kube-prometheus 之后 获取pod信息 获取不到
1 | [root@master kube-prometheus-0.14.0]# kubectl top pod |
排查思路
检查 apiservice
查询的接口是 v1beta1.metrics.k8s.io
这个功能是依赖 kube-prometheus 中的 prometheus-adapter 组件, 通过查询prometheus中获取到的指标信息.
1 | [root@master manifests]# kubectl get apiservice v1beta1.metrics.k8s.io |
原先 安装的是metrics-service 这个接口的信息是其提供的
1 | $ kubectl get apiservice v1beta1.metrics.k8s.io |
那么可以定位问题出在prometheus-adapter上。
检查prometheus-adapter配置
1 | cat prometheusAdapter-deployment.yaml |
1 | apiVersion: apps/v1 |
可知prometheus-adapter从prometheus中获取指标数据,接着检查其配置文件configmap:
查询
1 | cat prometheusAdapter-configMap.yaml |
1 | apiVersion: v1 |
可知kube top命令所显示的数据应当是由上述配置文件中的promQL提供,kube top命令无法显示数据是因为上述查询语句没有数据返回。
我们开启prometheus的query_log_file https://prometheus.io/docs/guides/query-log/
功能,抓取一下具体的查询语句。kube-prometheus的开启方法见https://github.com/prometheus-operator/prometheus-operator/blob/v0.49.0/Documentation/api.md#prometheusspec,
如下配置将查询记录输出到标准输出。
1 | $ cat prometheus-prometheus.yaml |
执行kubectl top node后使用kubectl logs prometheus-k8s-0 -c prometheus -n monitoring | grep container_memory_working_set_bytes 抓取到的两个promQL为:
1 | {"httpRequest":{"clientIP":"10.244.1.179","method":"GET","path":"/api/v1/query"},"params":{"end":"2024-12-30T16:31:11.061Z","query":"sum by (pod,container) (\n irate (\n container_cpu_usage_seconds_total{namespace=\"default\",pod=\"php-apache-675bc649f5-tcb2w\",container!=\"\",pod!=\"\"}[120s]\n )\n)\n","start":"2024-12-30T16:31:11.061Z","step":0},"spanID":"0000000000000000","stats":{"timings":{"evalTotalTime":0.000145861,"resultSortTime":0,"queryPreparationTime":0.000036583,"innerEvalTime":0.00010043,"execQueueTime":0.000006156,"execTotalTime":0.000151328},"samples":{"totalQueryableSamples":0,"peakSamples":0}},"ts":"2024-12-30T16:31:11.065Z"} |
将语句拿出来去 prometheus 中验证
发现查询 cpu 与 memory 的条件中增加了
1 | container!="" |
但是指标中却没有这个标签 .
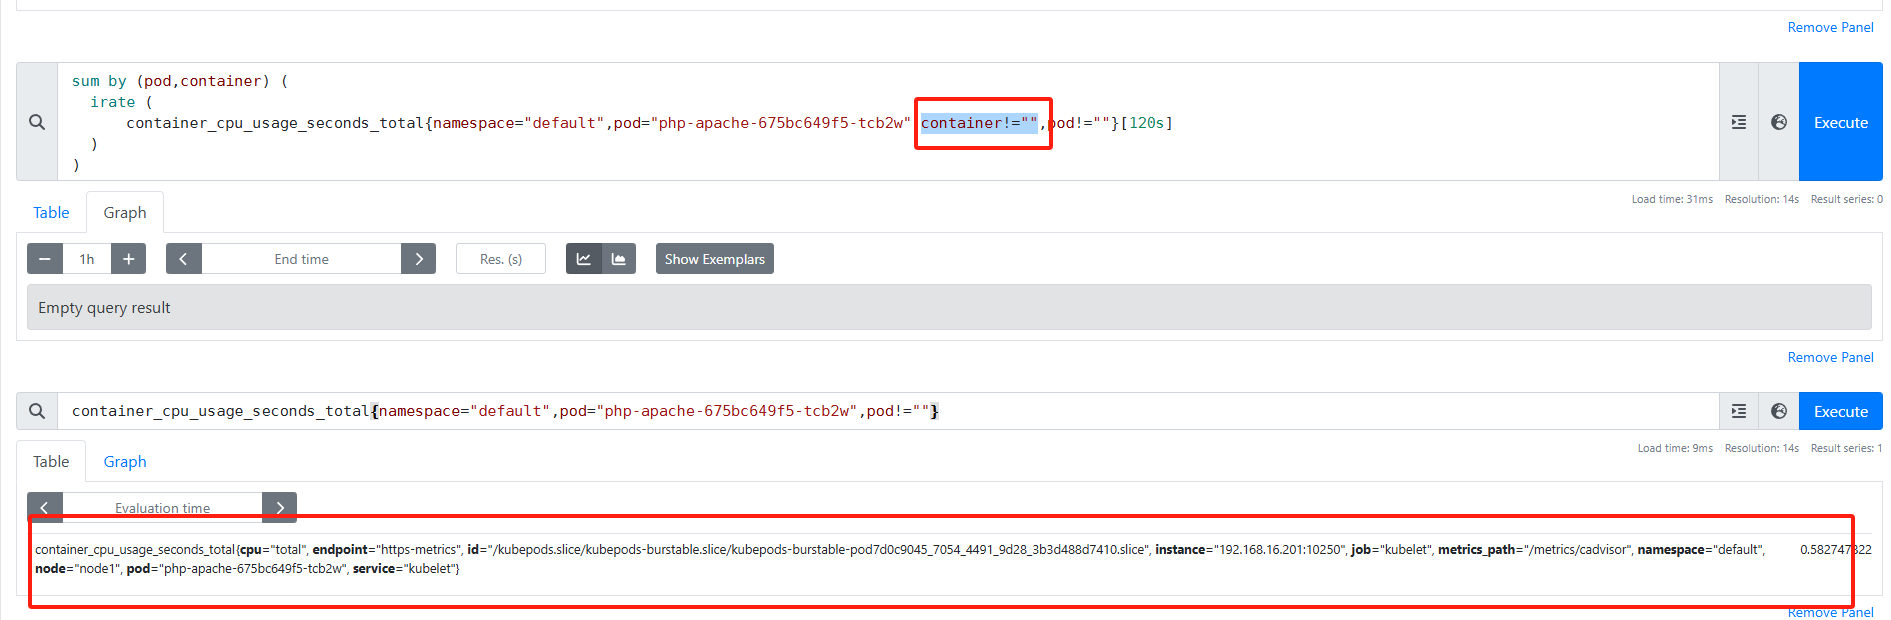
将这两个标签删除
1 | apiVersion: v1 |
重新部署了一遍. 问题解除了
具体为什么缺失了这个标签. 可能是k8s更新太快了 adapter 与高版本的k8s的适配性没有及时调整